Kể từ bây giờ chúng tôi là Elev8
Chúng tôi không chỉ là một nhà môi giới. Chúng tôi là một hệ sinh thái giao dịch tất cả trong một—mọi thứ bạn cần để phân tích, giao dịch và phát triển đều có ở một nơi. Sẵn sàng nâng tầm giao dịch của bạn?
Chúng tôi không chỉ là một nhà môi giới. Chúng tôi là một hệ sinh thái giao dịch tất cả trong một—mọi thứ bạn cần để phân tích, giao dịch và phát triển đều có ở một nơi. Sẵn sàng nâng tầm giao dịch của bạn?
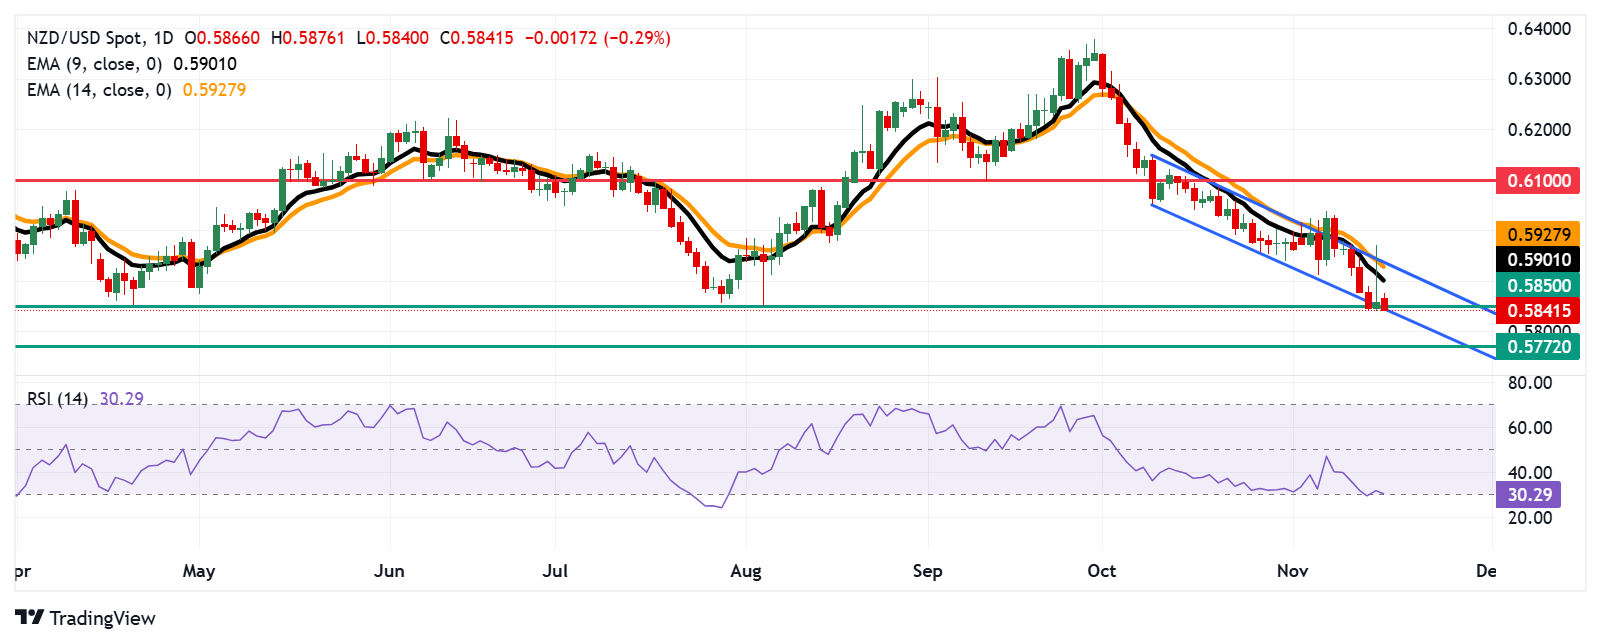
The NZD/USD pair retraces its recent gains, trading around 0.5850 during the European hours on Monday. A review of the daily chart highlights a growing bearish bias, as the pair tests the lower boundary of its descending channel pattern.
The nine-day Exponential Moving Average (EMA) remains below the 14-day EMA, signaling persistent weakness in short-term price momentum. Meanwhile, the 14-day Relative Strength Index (RSI) hovers around the 30 level, indicating oversold conditions for the NZD/USD pair and hinting at the possibility of an upward correction.
Regarding the support, the NZD/USD pair is testing the lower boundary of the descending channel, which aligns with the throwback support at the psychological level of 0.5850. A decisive break below this channel would reinforce the bearish outlook, increasing downward pressure and potentially driving the pair toward its two-year low of 0.5772, last seen in November 2023.
On the upside, immediate resistance lies at the nine-day EMA at 0.5901, followed by the 14-day EMA at 0.5928, which coincides with the upper boundary of the descending channel. A breakout above this channel would enhance bullish momentum, paving the way for the NZD/USD pair to target the psychological level of 0.6100.
The table below shows the percentage change of New Zealand Dollar (NZD) against listed major currencies today. New Zealand Dollar was the weakest against the Euro.
| USD | EUR | GBP | JPY | CAD | AUD | NZD | CHF | |
|---|---|---|---|---|---|---|---|---|
| USD | -0.05% | 0.03% | 0.40% | 0.10% | 0.16% | 0.42% | -0.12% | |
| EUR | 0.05% | 0.25% | 0.57% | 0.26% | 0.35% | 0.59% | 0.05% | |
| GBP | -0.03% | -0.25% | 0.33% | 0.00% | 0.09% | 0.34% | -0.21% | |
| JPY | -0.40% | -0.57% | -0.33% | -0.31% | -0.18% | 0.08% | -0.44% | |
| CAD | -0.10% | -0.26% | -0.01% | 0.31% | 0.08% | 0.32% | -0.21% | |
| AUD | -0.16% | -0.35% | -0.09% | 0.18% | -0.08% | 0.24% | -0.32% | |
| NZD | -0.42% | -0.59% | -0.34% | -0.08% | -0.32% | -0.24% | -0.53% | |
| CHF | 0.12% | -0.05% | 0.21% | 0.44% | 0.21% | 0.32% | 0.53% |
The heat map shows percentage changes of major currencies against each other. The base currency is picked from the left column, while the quote currency is picked from the top row. For example, if you pick the New Zealand Dollar from the left column and move along the horizontal line to the US Dollar, the percentage change displayed in the box will represent NZD (base)/USD (quote).