A partir de agora, somos Elev8
Somos mais do que apenas uma corretora. Somos um ecossistema completo de trading — tudo que você precisa para analisar, operar e crescer está em um único lugar. Pronto para aprimorar seu trading?
Somos mais do que apenas uma corretora. Somos um ecossistema completo de trading — tudo que você precisa para analisar, operar e crescer está em um único lugar. Pronto para aprimorar seu trading?
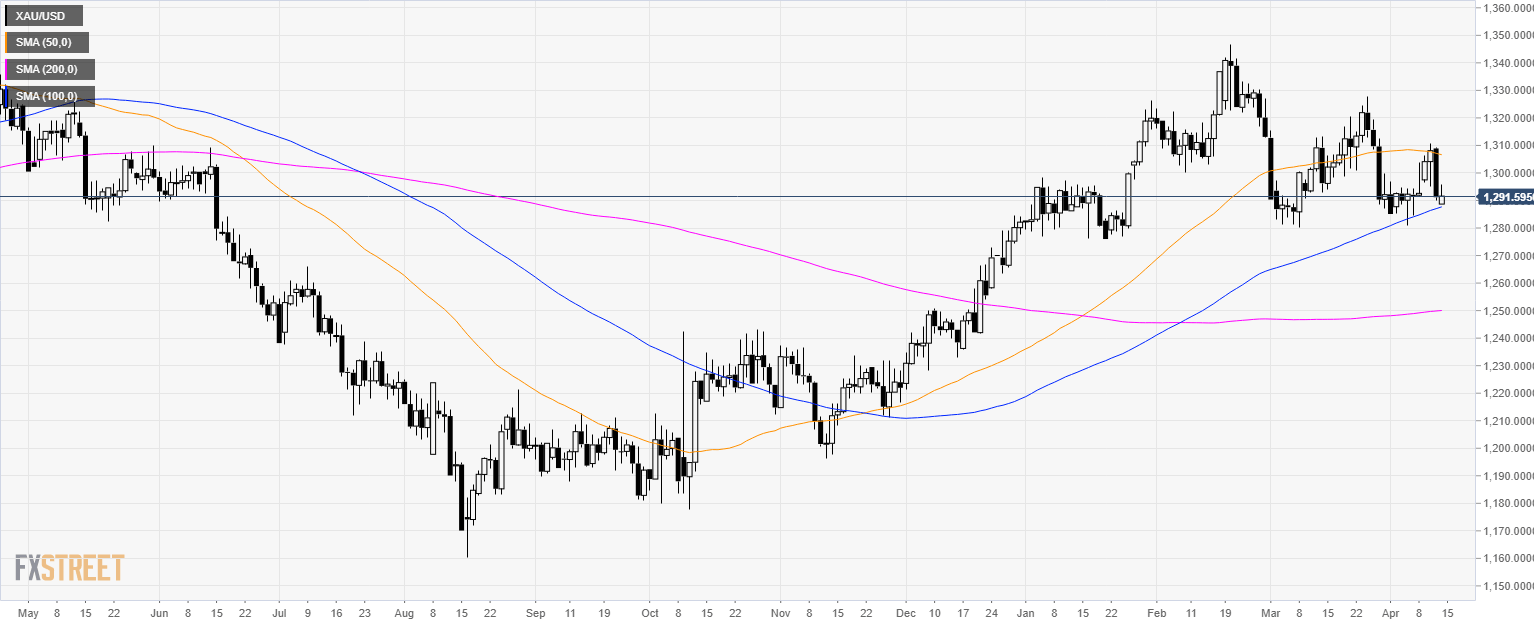
Gold daily chart
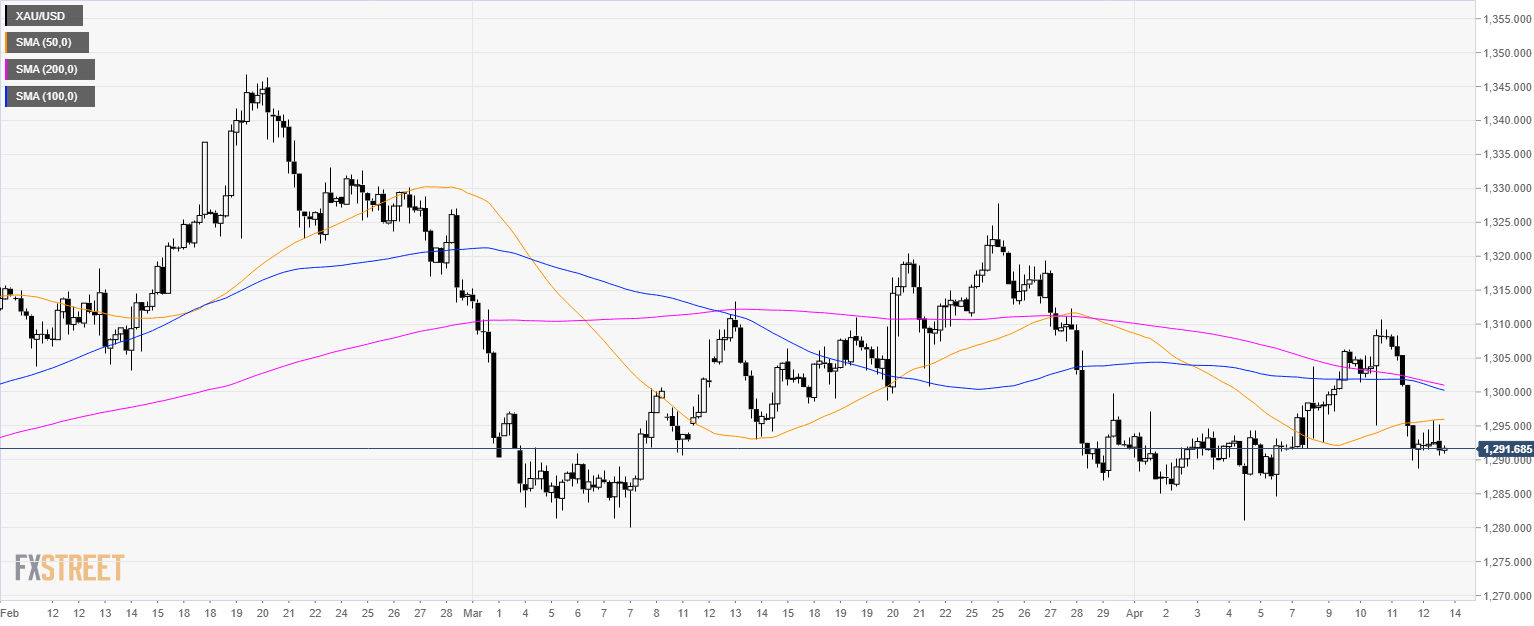
Gold 4-hour chart
Gold 30-minute chart
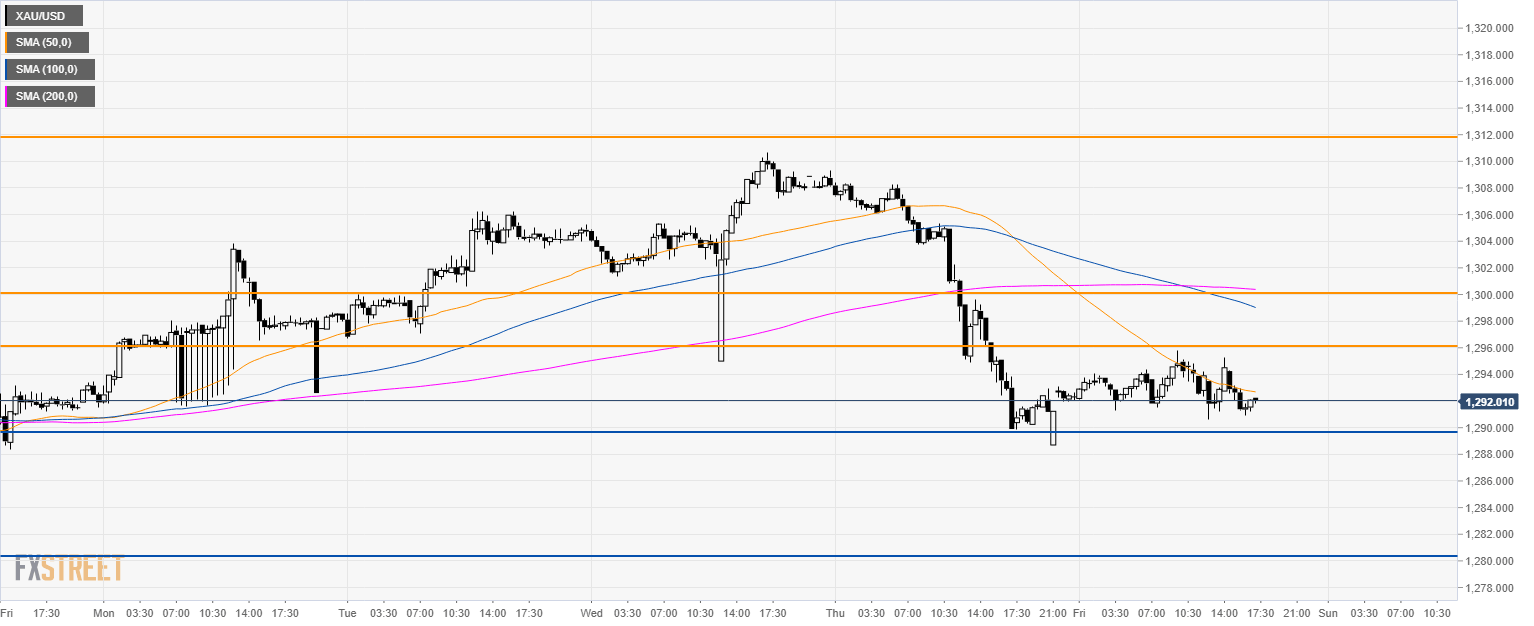
Additional key levels