From now on we Elev8
We're more than just a broker. We're an all-in-one trading ecosystem—everything you need to analyse, trade, and grow is in one place. Ready to elevate your trading?
We're more than just a broker. We're an all-in-one trading ecosystem—everything you need to analyse, trade, and grow is in one place. Ready to elevate your trading?
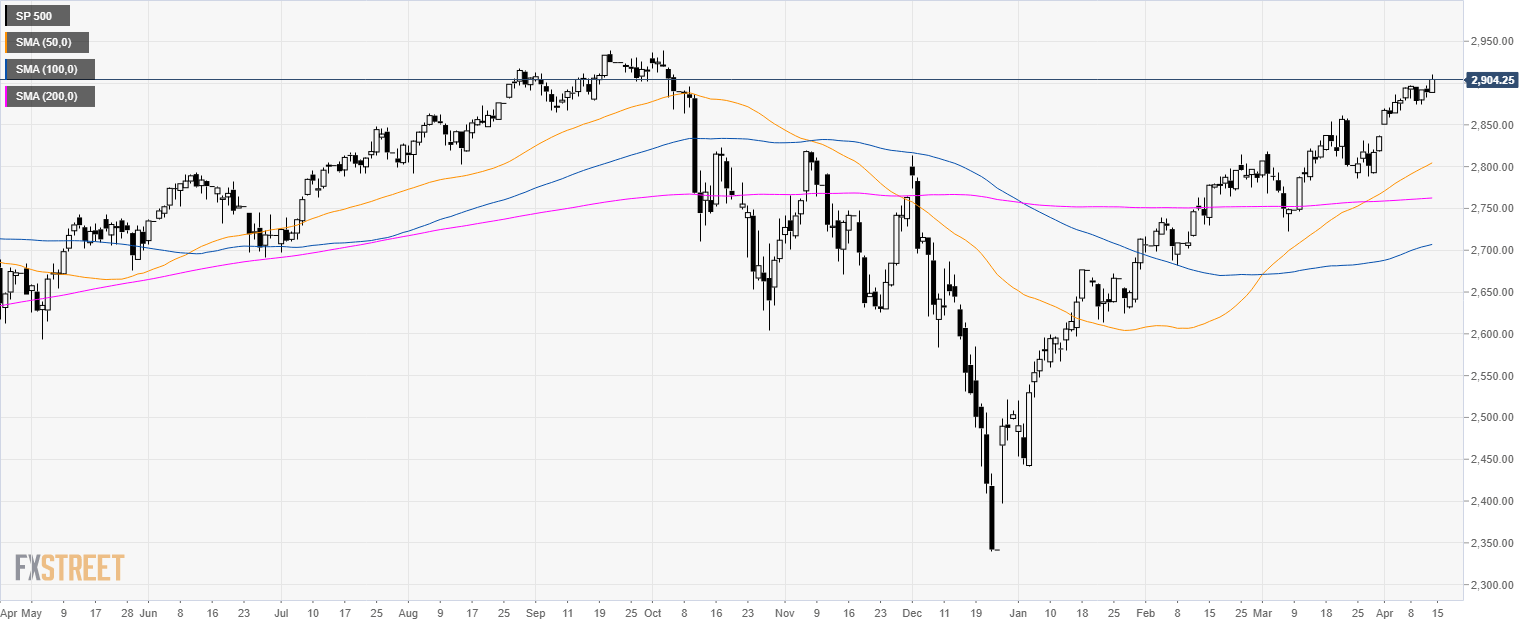
S&P500 daily chart
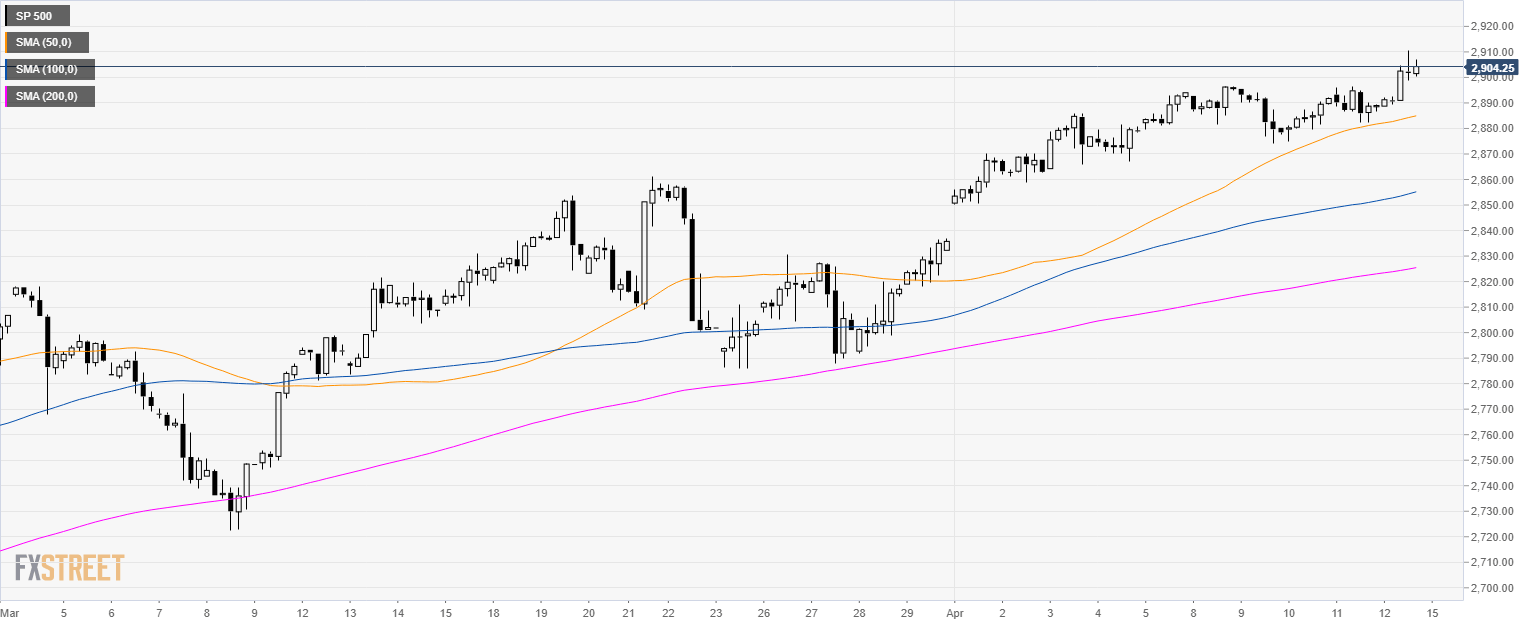
S&P500 4-hour chart
S&P500 60-minute chart
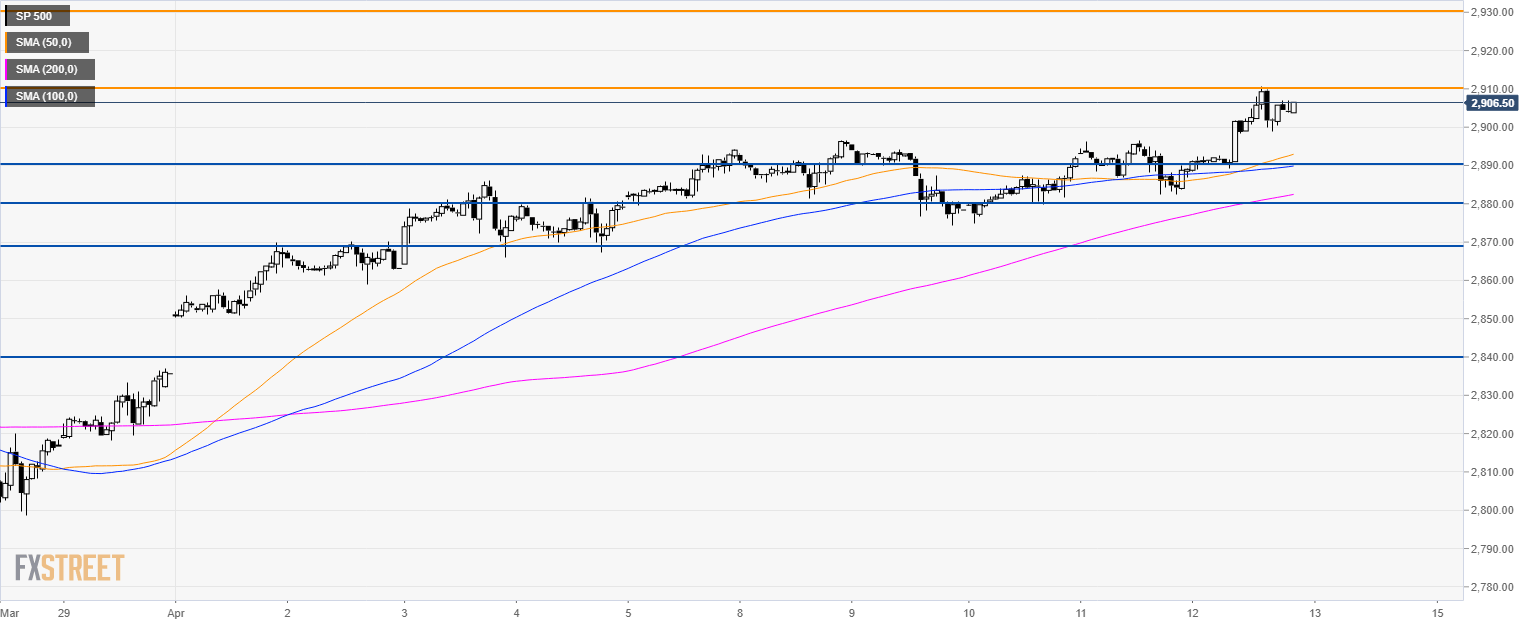
Additional key levels