اب سے ہم Elev8 ہیں
ہم صرف ایک بروکر نہیں ہیں۔ ہم ایک جامع ٹریڈنگ ایکوسسٹم ہیں—ہر چیز جو آپ کو تجزیے، ٹریڈ اور ترقی کے لیے درکار ہو، ایک ہی جگہ پر ہے۔ کیا آپ اپنی ٹریڈنگ کو بلند کرنے کے لیے تیار ہیں؟
ہم صرف ایک بروکر نہیں ہیں۔ ہم ایک جامع ٹریڈنگ ایکوسسٹم ہیں—ہر چیز جو آپ کو تجزیے، ٹریڈ اور ترقی کے لیے درکار ہو، ایک ہی جگہ پر ہے۔ کیا آپ اپنی ٹریڈنگ کو بلند کرنے کے لیے تیار ہیں؟
USD/IDR trades near 13,630 during the early Monday. In doing so, the pair extends the declines below 50-month SMA and 23.6% Fibonacci retracement of its broad run-up from August 2011 to October 2018.
The pair now rests on the multi-month-old support trend line stretched from October 2016, currently around 13,600.
As a result, the bears are looking for a monthly break below the key support line to take aim at October 2016 bottom surrounding 12,930. Though, the year 2018 bottom close 13,270 could offer an intermediate halt.
Meanwhile, a pullback from the current levels needs to cross 50-month SMA, at 13,770 now, to revisit 14,000 and August 2019 high near 14,350.
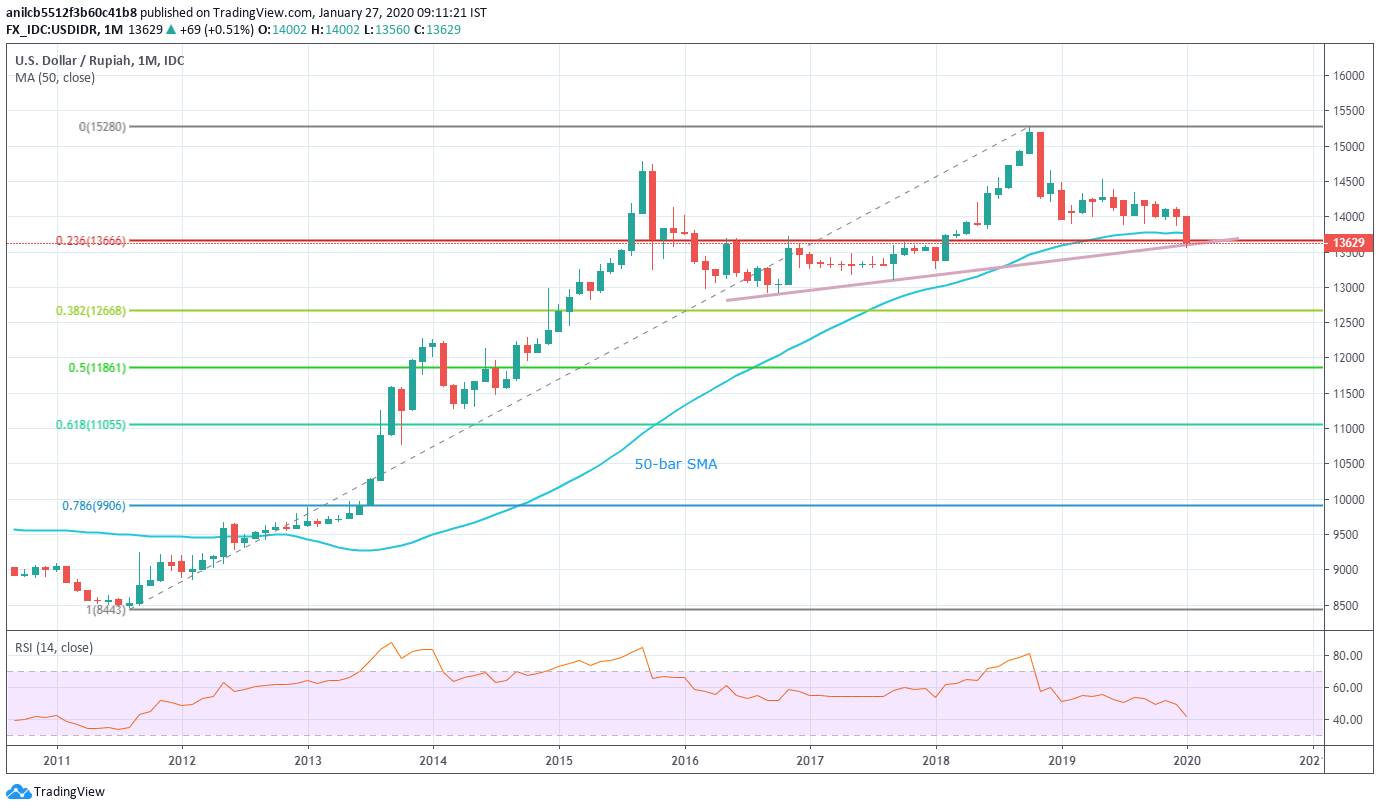
Trend: Pullback expected