এখন থেকে আমরা Elev8
আমরা শুধুমাত্র একটি ব্রোকার নই। আমরা একটি সর্বাত্মক ট্রেডিং ইকোসিস্টেম—বিশ্লেষণ, ট্রেড, এবং প্রবৃদ্ধির জন্য আপনার যা কিছু প্রয়োজন তা এক জায়গায়। আপনার ট্রেডিং উন্নত করতে প্রস্তুত?
আমরা শুধুমাত্র একটি ব্রোকার নই। আমরা একটি সর্বাত্মক ট্রেডিং ইকোসিস্টেম—বিশ্লেষণ, ট্রেড, এবং প্রবৃদ্ধির জন্য আপনার যা কিছু প্রয়োজন তা এক জায়গায়। আপনার ট্রেডিং উন্নত করতে প্রস্তুত?
WTI pulls back from the intra-day high of $54.08 to $53.75 by the press time of early Asian session on Wednesday. In doing so, the energy benchmark fails to clear the short-term key moving average. The same, while mixed with bearish MACD, portrays the underlying momentum weakness in the black gold’s trading.
Not only a 5-day SMA level of $54.05 but November 20, 2019 low near $54.85 and 61.8% Fibonacci retracement of the commodity’s August 2019 to January 2020 upside, at $56.25, also act as the key upside barriers.
Should oil prices manage to cross $56.25 on a daily closing basis, the bulls can aim for $57.50.
Alternatively, the recent low of $52.15 and an upward sloping trend line since August 07, 2019, at $51.65 now, can please the sellers during fresh declines.
During the quote’s additional weakness past-$51.65, October 2019 low of $50.95 and August 20018 bottom around $50.50 can offer intermediate halts before highlighting $50.00 for the bears.
It’s worth mentioning that the private reading of the US weekly oil inventories published by the American Petroleum Institute (API) recently confirmed a draw of 4.27 million barrels for the week ended on January 24.
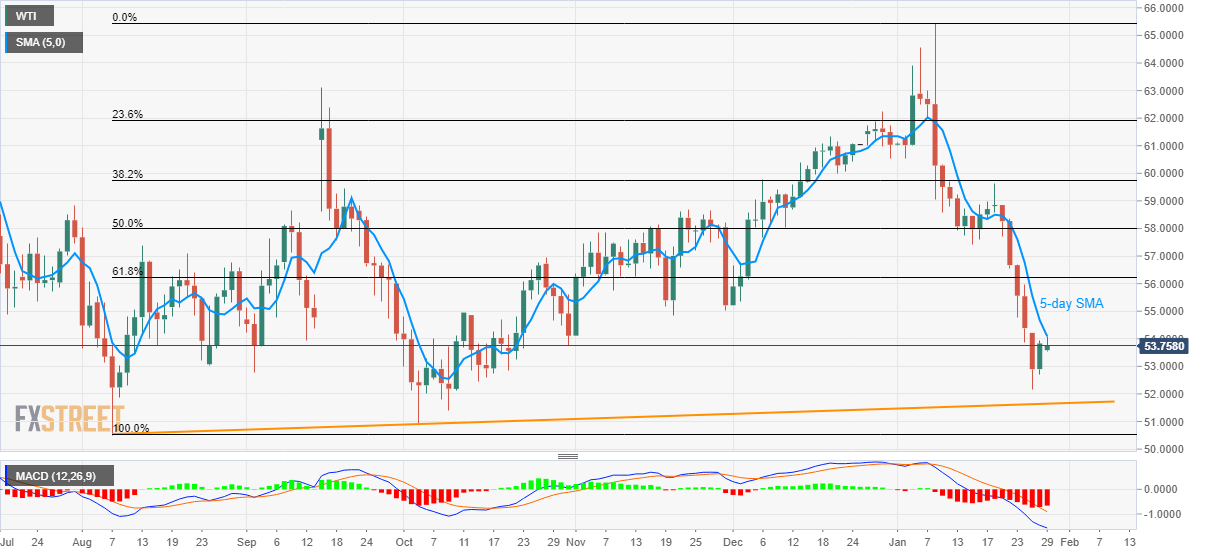
Trend: Bearish