اب سے ہم Elev8 ہیں
ہم صرف ایک بروکر نہیں ہیں۔ ہم ایک جامع ٹریڈنگ ایکوسسٹم ہیں—ہر چیز جو آپ کو تجزیے، ٹریڈ اور ترقی کے لیے درکار ہو، ایک ہی جگہ پر ہے۔ کیا آپ اپنی ٹریڈنگ کو بلند کرنے کے لیے تیار ہیں؟
ہم صرف ایک بروکر نہیں ہیں۔ ہم ایک جامع ٹریڈنگ ایکوسسٹم ہیں—ہر چیز جو آپ کو تجزیے، ٹریڈ اور ترقی کے لیے درکار ہو، ایک ہی جگہ پر ہے۔ کیا آپ اپنی ٹریڈنگ کو بلند کرنے کے لیے تیار ہیں؟
AUD/JPY trades near 73.71 during the early Wednesday morning in Asia. In doing so, the pair remains inside the short-term symmetrical triangle formation. However, bullish MACD signals and a broad risk recovery seem to favor the quote’s further upside.
That said, the triangle’s resistance around 74.00 will be the trigger for the fresh run-up towards the last week’s top surrounding 74.40.
However, a confluence of 200-bar SMA and 61.58% Fibonacci retracement of the pair’s declines between January 16 and February 02, around 74.77/80, will be the key resistance holding the gate for the arrival of 75.00.
On the downside, the triangle support and 23.6% Fibonacci retracement limit the pair’s near-term declines close to 73.30.
Should AUD/JPY prices slip below 73.30, 73.00 and the monthly low around 72.40 will return to the charts.
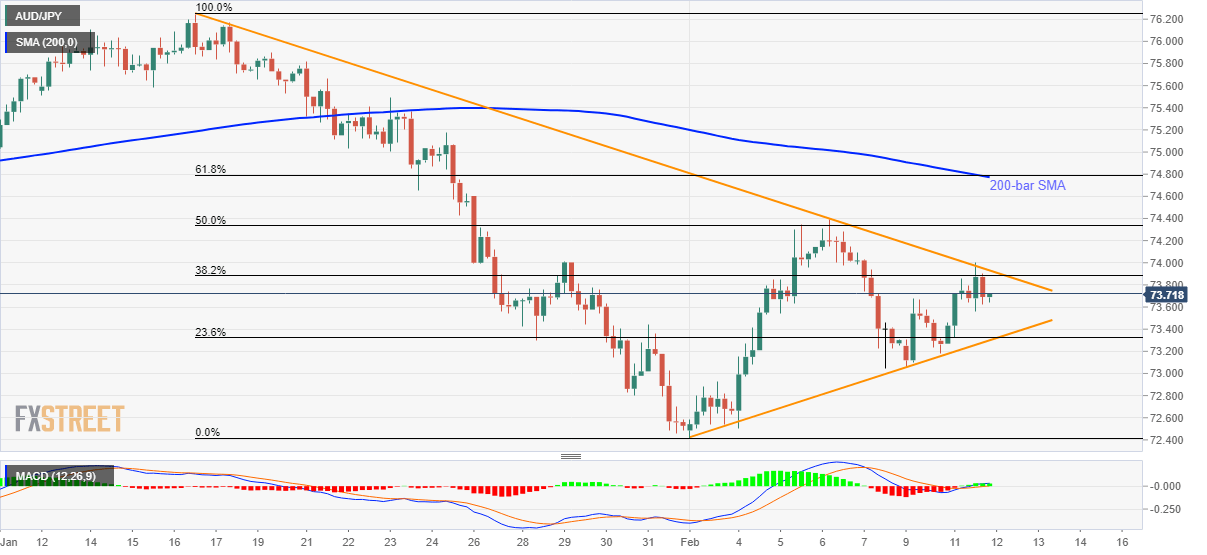
Trend: Further recovery expected